
Automated Revenue Anomaly Detection for AdOps: Tracking eCPM Drops, Fill Collapse, and Timeout Spikes
A single malformed ortb2Imp object pushed during a routine Thursday afternoon frontend deployment can silently drop Prebid.js bid density by 40% on Safari

A single malformed ortb2Imp object pushed during a routine Thursday afternoon frontend deployment can silently drop Prebid.js bid density by 40% on Safari iOS while leaving aggregate desktop revenue untouched. Because programmatic supply chains operate as distributed, multi-hop auctions across client-side wrappers, server-side endpoints, and primary ad servers like Google Ad Manager (GAM), revenue failures rarely trigger HTTP 500 alerts in standard application performance monitoring tools. From the perspective of an engineering team's infrastructure dashboard, the web page or mobile app screen loads normally, the DOM renders without uncaught exceptions, and CDN cache hit ratios remain stable. Meanwhile, the ad stack is bleeding thousands of dollars per hour because an upstream consent string parser failed to populate the regs.ext.gdpr field or a VAST 4.3 wrapper chain exceeded the video player's max redirect threshold.
Traditional revenue monitoring relies on next-day accounting reconciliations or manual spreadsheet checks performed by yield analysts every morning. In high-volume programmatic environments across Web, Mobile App, and Connected TV (CTV), a 14-hour detection lag between an engineering regression and an AdOps ticket is financially unsustainable. When a publisher processes 50 million auctions per day, a localized timeout spike or a broken OpenRTB 2.6 supply path can permanently destroy working capital before the next day's GAM historical report finishes processing.
Building resilient revenue observability requires treating ad stack performance as a real-time distributed telemetry problem rather than an accounting exercise. By decoupling compound metrics like revenue per thousand impressions (RPM) into atomic auction-level signals, engineering and yield teams can detect eCPM compression, fill collapse, and bidder timeout spikes within minutes of onset.
Why Daily Aggregated Reports Miss 6-Hour Broken Tag Outages
Programmatic traffic follows pronounced diurnal and day-of-week seasonality curves that easily mask severe, localized outages when data is rolled up into 24-hour UTC buckets. Consider a high-traffic news publisher whose North American prime-time traffic peaks between 17:00 and 23:00 UTC. If a faulty tag configuration or a broken Prebid Server adapter deployment strips the imp.banner.format array for six hours during off-peak European morning hours, the resulting 85% fill collapse in that specific window may only register as a 7% dip in the full-day aggregated revenue report. Yield managers reviewing daily totals the following morning routinely dismiss a 7% variance as normal buyer budget pacing, end-of-month DSP throttling, or organic traffic fluctuation.
Furthermore, aggregate reporting introduces severe structural blind spots through cross-segment averaging. A simultaneous spike in direct-sold sponsorship impressions or a viral social traffic surge can inflate top-line gross revenue on the exact same day that an open-exchange Android release build suffers a complete Google Mobile Ads (GMA) Next-Gen SDK initialization failure. When positive volume variances in one segment cancel out catastrophic yield failures in another, daily rollups report a healthy baseline.
Batch reporting pipelines also suffer from inherent ingestion latency and multi-stage reconciliation adjustments. Standard ad server reports often lag by three to six hours for raw delivery counters and up to 24 hours for finalized, IVT-filtered net revenue. Waiting for batch settlement tables to confirm an outage turns incident response into a post-mortem exercise. Instead, publishers need anomaly-aware reporting dashboards that ingest low-latency auction telemetry streams, evaluate metrics at 15-minute or 60-minute intervals, and compare current performance against same-hour-of-week historical baselines rather than static daily thresholds.
The 4 Golden Telemetry Metrics for Publisher Monetization
In site reliability engineering, distributed systems are monitored through latency, traffic, errors, and saturation. In programmatic monetization, those infrastructure primitives map directly to four golden telemetry metrics: Bid Request Volume, Bid Response Rate (alongside Timeout Rate), Win-to-Render Conversion Rate, and Clearing eCPM. Monitoring revenue or session RPM in isolation is ineffective because total revenue is a lagging mathematical product of these four underlying variables. When gross revenue drops by 25%, an alert on revenue alone cannot tell the on-call engineer whether user traffic vanished, tier-1 DSPs stopped bidding, auction timeouts spiked, or winning creatives failed to render in the viewport.
By instrumenting the client-side wrapper (such as Prebid.js 11.x or Prebid Mobile SDK) and the server-side stitcher (for CTV VAST 4.3 SSAI workflows) to emit structured telemetry payloads at each stage of the auction lifecycle, AdOps architectures can isolate the exact failure boundary. If request volume remains flat against the 4-week trailing average while clearing eCPM collapses, the diagnostic engine immediately rules out CMS template breakage and focuses on bid density, floor elasticity, and identity signal transmission.
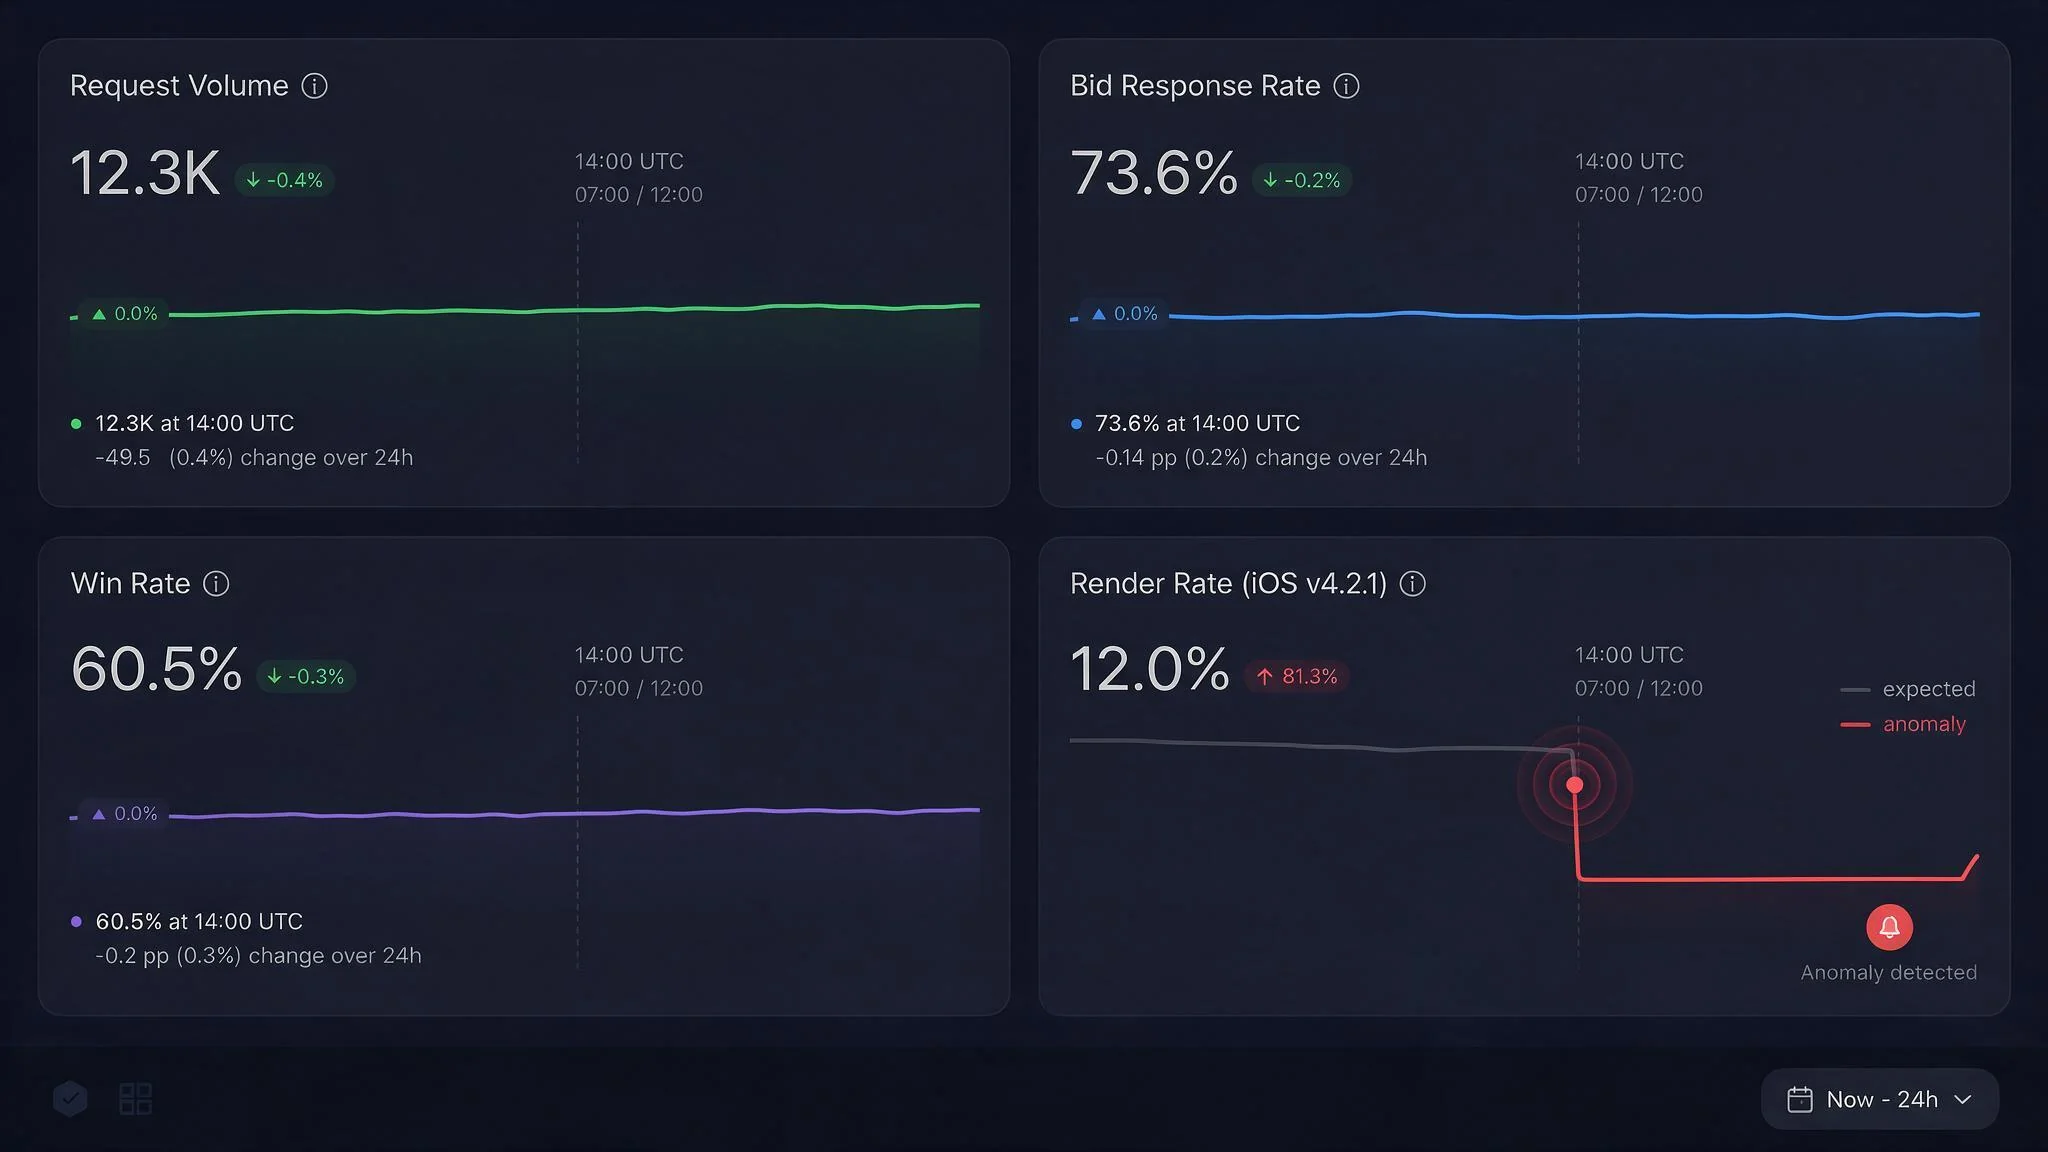
Tracking these four metrics independently also prevents false-positive alert fatigue during intentional yield adjustments. When an AdOps team raises dynamic unified pricing rules in GAM to capture higher clearing prices from curated direct and semi-direct demand, bid response rates will naturally contract as lower-tier bids are filtered out. An observability pipeline that tracks the inverse correlation between floor-driven fill adjustments and clearing eCPM recognizes this shift as expected price elasticity rather than an infrastructure incident.
Bid Request Volume vs. Bid Response Rate (Fill %)
Decoupling supply availability from buyer participation begins with comparing outbound Bid Request Volume against inbound Bid Response Rate. Bid Request Volume measures the number of valid ad opportunities generated by the publisher's properties, whereas Bid Response Rate tracks the percentage of those requests that return at least one valid, above-floor bid payload before the auction clock expires. When marketers model baseline yield expectations, they often assume a static fill ratio, yet in production environments, the spread between request volume and response rate is highly volatile.
When Bid Request Volume drops sharply while Bid Response Rate remains stable, the root cause almost always resides on the publisher's property or within the consent layer:
- CMP and Privacy Signal Failures: A broken TCF v2.2 implementation or a stalled GPP (Global Privacy Platform) event listener delays the auction trigger until the user navigates away from the page.
- DOM and Layout Regressions: Frontend engineering updates rename the target container
divIDs (for example, changingad-slot-leaderboard-1toad-banner-top), causing Google Publisher Tag (GPT)defineSlotcalls to fail silently without issuing ad requests. - QPS Throttling and Supply Path Filtering: Upstream SSP endpoints or Prebid Server clusters hit configured QPS limits and drop outbound requests before they reach DSP bidder endpoints.
Conversely, when Bid Request Volume holds steady but Bid Response Rate (Fill %) plunges, the request payload itself is reaching the market in a degraded state or failing to clear before the wrapper timeout. In OpenRTB 2.6 server-to-server connections, inspecting the nbr (No-Bid Reason) integer in the bid response provides immediate diagnostic clarity. A sudden surge in nbr: 2 (Invalid Banner/Video Specification), nbr: 5 (Suspected Non-Human Traffic / IVT), or nbr: 8 (Unmatched User) points directly to broken inventory metadata, missing schain (SupplyChain) nodes, or stripped user identity modules (user.ext.eids). Simultaneously, tracking the Prebid bidTimeout event rate distinguishes between true buyer no-bids and network latency spikes where participating SSP partners respond 50 milliseconds after the PREBID_TIMEOUT window closes.
Win Rate vs. Render Rate (The Discrepancy Signal)
The most financially damaging programmatic outages occur when an auction completes normally, a bidder wins the impression in the wrapper or via Open Bidding, and the creative subsequently fails to render on the user's device. Because industry standards mandate counting and billing impressions on render (specifically when the creative begins loading in the DOM or when the first frame of a video ad plays), a divergence between Win Rate and Render Rate creates an immediate revenue black hole known as the discrepancy gap.
In a healthy web header bidding environment, the ratio of won auctions (bidWon or GAM line item selection) to rendered impressions (adRenderSucceeded or GPT slotRenderEnded with isEmpty: false) stays tightly bounded, accounting only for natural user page abandonment during the 150-to-400 millisecond creative load window. When the Win-to-Render conversion rate drops by more than 8% within an hourly window, it signals a severe downstream delivery fault:
- Creative SafeFrame and Malware Blocks: A DSP pushes a heavy or non-compliant JavaScript creative that triggers Chromium's Heavy Ad Intervention or gets blocked by browser-level content security policies (CSP).
- Out-of-Viewport Lazy Loading Bugs: The auction executes eagerly in the header (
fetchMarginPercentset too broadly), winning bids in GAM, but a broken intersection observer prevents thegoogletag.display()call from firing when the user scrolls down. - CTV VAST 4.3 and SSAI Stitching Failures: In Connected TV environments running on Roku (RAF), Samsung Tizen, or Apple tvOS, an SSAI stitcher wins a programmatic pod bid, but the returned VAST XML contains a mezzanine file with an unsupported codec or bitrate, triggering VAST Error 403 (Couldn't find MediaFile that is supported by this video player) or VAST Error 301 (Timeout of VAST URI provided in Wrapper element).
Capturing this discrepancy signal requires lightweight client-side event hooks that pipe wrapper and ad server states into an analytics collector. The following production JavaScript snippet demonstrates how to instrument Prebid.js 11.x and GPT to capture timeout spikes and render failures in real time:
window.pbjs = window.pbjs || { que: [] };
window.googletag = window.googletag || { cmd: [] };

const sendTelemetry = (eventType, payload) => {
  if (navigator.sendBeacon) {
    const body = JSON.stringify({
      event: eventType,
      ts: Date.now(),
      os: navigator.platform,
      ua: navigator.userAgent,
      ...payload
    });
    navigator.sendBeacon('https://telemetry.example.com/v1/adops-ingest', body);
  }
};

pbjs.que.push(function () {
  pbjs.onEvent('bidTimeout', function (timedOutBidders) {
    const bidders = timedOutBidders.map(b => ({
      bidder: b.bidder,
      adUnit: b.adUnitCode,
      timeoutThreshold: b.timeout
    }));
    sendTelemetry('prebid_timeout_spike', { count: bidders.length, bidders });
  });

  pbjs.onEvent('adRenderFailed', function (failData) {
    sendTelemetry('prebid_render_failed', {
      bidder: failData.bid.bidderCode,
      adUnit: failData.adUnitCode,
      reason: failData.reason,
      message: failData.message,
      cpm: failData.bid.cpm
    });
  });
});

googletag.cmd.push(function () {
  googletag.pubads().addEventListener('slotRenderEnded', function (event) {
    sendTelemetry('gpt_slot_render', {
      slotId: event.slot.getSlotElementId(),
      isEmpty: event.isEmpty,
      lineItemId: event.lineItemId,
      creativeId: event.creativeId,
      advertiserId: event.advertiserId
    });
  });
});
Segmenting Alerts by OS Version, App Release Build, and Browser Engine
Running anomaly detection models solely on global, unsegmented metrics guarantees either high false-positive rates or missed micro-outages. Modern programmatic supply is deeply fragmented across client execution environments. An anomaly detection engine must partition telemetry streams across three mandatory dimensional slices: Operating System version, App Release Build (app.ver in OpenRTB 2.6), and Browser Engine (Chromium Blink, Apple WebKit, and Mozilla Gecko).
Browser engine segmentation is critical for web monetization because privacy sandboxing, cookie deprecation, and storage partitioning rules diverge sharply across engines. For instance, if an identity resolution module update introduces a syntax error when reading local storage on WebKit, Safari iOS and macOS eCPMs may drop by 35% due to missing first-party ID graphs, while Chrome on Android and Windows continues to monetize at full bid density. For a publisher whose traffic is 70% Chrome, the blended eCPM drop might only register as 10%, staying inside the normal statistical noise band unless WebKit traffic is evaluated in an isolated time-series partition.
In Mobile App and CTV environments, segmenting by app.ver and SDK version is the fastest way to catch regressions introduced during staged app store rollouts. When a mobile publisher rolls out version 4.12.0 to 10% of their iOS user base via TestFlight or phased App Store release, a misconfigured GMA Next-Gen SDK initialization call or an omitted SKAdNetworkItems plist entry will only affect that 10% cohort. By partnering with a unified monetization platform that automatically indexes metrics by app.ver, OS minor version (such as iOS 18.2 vs. iOS 17.6), and device make (such as Roku Ultra vs. Amazon Fire TV Stick 4K), AdOps teams can halt a defective staged rollout before it reaches 100% adoption.
However, multi-dimensional slicing introduces the high-cardinality sparsity problem. Slicing hourly data by Country, Device Type, OS Version, Browser Engine, Placement ID, and Demand Partner simultaneously creates hundreds of thousands of sparse time series where low-volume buckets trigger constant false alarms. To maintain high signal-to-noise precision, production alerting pipelines enforce a minimum volume floor (for example, requiring at least 2,500 bid requests per hour within a dimensional slice) before evaluating statistical Z-scores.
SQL Window Functions (Z-Score and Moving Averages) for Hourly AdOps Alerting
Static threshold alerts (such as "alert if eCPM drops below $1.50" or "alert if timeout rate exceeds 15%") fail immediately in programmatic advertising because baseline metrics shift continuously across hours of the day, days of the week, and seasonal retail quarters. An eCPM of $1.80 at 03:00 UTC on a Tuesday in January might represent top-decile performance, whereas the exact same $1.80 eCPM at 19:00 UTC on Black Friday represents a catastrophic system failure.
To account for both intraday diurnal cycles and day-of-week variance without deploying heavy machine learning infrastructure, AdOps data engineering teams can implement Seasonally Adjusted Z-Score detection directly inside their analytical data warehouse (such as BigQuery, ClickHouse, or Snowflake) using SQL window functions. Instead of comparing the current hour against the immediately preceding three hours (which fails during steep morning traffic ramp-ups), the query partitions data by the exact hour_of_week (ranging from 0 to 167). This compares Tuesday at 14:00 UTC against the trailing four Tuesdays at 14:00 UTC within the exact same OS and placement slice.
The Z-score measures how many standard deviations the current hour's metric sits away from the historical moving average:
$$Z = \frac{X_{t} - \mu_{\text{trailing}}}{\sigma_{\text{trailing}}}$$
The following production SQL query calculates rolling 4-week same-hour-of-week baselines and flags statistical anomalies across eCPM, fill rate, and timeout rate while enforcing a minimum request volume guard:
WITH hourly_telemetry AS (
    SELECT
        DATE_TRUNC('hour', event_timestamp) AS metric_hour,
        EXTRACT(DAYOFWEEK FROM event_timestamp) * 24 + EXTRACT(HOUR FROM event_timestamp) AS hour_of_week,
        os_family,
        browser_engine,
        placement_id,
        SUM(bid_requests) AS total_requests,
        SAFE_DIVIDE(SUM(bids_received), SUM(bid_requests)) AS fill_rate,
        SAFE_DIVIDE(SUM(timeouts), SUM(bid_requests)) AS timeout_rate,
        SAFE_DIVIDE(SUM(rendered_impressions), SUM(won_auctions)) AS render_rate,
        SAFE_DIVIDE(SUM(gross_revenue_micros) / 1000.0, SUM(rendered_impressions)) AS clearing_ecpm
    FROM
        adops_telemetry.hourly_auction_rollup
    WHERE
        event_timestamp >= TIMESTAMP_SUB(CURRENT_TIMESTAMP(), INTERVAL 35 DAY)
    GROUP BY
        1, 2, 3, 4, 5
),
seasonal_baselines AS (
    SELECT
        metric_hour,
        os_family,
        browser_engine,
        placement_id,
        total_requests,
        fill_rate,
        timeout_rate,
        render_rate,
        clearing_ecpm,
        AVG(clearing_ecpm) OVER (
            PARTITION BY os_family, browser_engine, placement_id, hour_of_week
            ORDER BY metric_hour
            ROWS BETWEEN 4 PRECEDING AND 1 PRECEDING
        ) AS mean_ecpm_4wk,
        STDDEV_SAMP(clearing_ecpm) OVER (
            PARTITION BY os_family, browser_engine, placement_id, hour_of_week
            ORDER BY metric_hour
            ROWS BETWEEN 4 PRECEDING AND 1 PRECEDING
        ) AS stddev_ecpm_4wk,
        AVG(fill_rate) OVER (
            PARTITION BY os_family, browser_engine, placement_id, hour_of_week
            ORDER BY metric_hour
            ROWS BETWEEN 4 PRECEDING AND 1 PRECEDING
        ) AS mean_fill_4wk,
        STDDEV_SAMP(fill_rate) OVER (
            PARTITION BY os_family, browser_engine, placement_id, hour_of_week
            ORDER BY metric_hour
            ROWS BETWEEN 4 PRECEDING AND 1 PRECEDING
        ) AS stddev_fill_4wk,
        AVG(timeout_rate) OVER (
            PARTITION BY os_family, browser_engine, placement_id, hour_of_week
            ORDER BY metric_hour
            ROWS BETWEEN 4 PRECEDING AND 1 PRECEDING
        ) AS mean_timeout_4wk,
        STDDEV_SAMP(timeout_rate) OVER (
            PARTITION BY os_family, browser_engine, placement_id, hour_of_week
            ORDER BY metric_hour
            ROWS BETWEEN 4 PRECEDING AND 1 PRECEDING
        ) AS stddev_timeout_4wk
    FROM
        hourly_telemetry
)
SELECT
    metric_hour,
    os_family,
    browser_engine,
    placement_id,
    total_requests,
    ROUND(clearing_ecpm, 3) AS current_ecpm,
    ROUND(mean_ecpm_4wk, 3) AS expected_ecpm,
    ROUND(SAFE_DIVIDE(clearing_ecpm - mean_ecpm_4wk, NULLIF(stddev_ecpm_4wk, 0)), 2) AS ecpm_z_score,
    ROUND(SAFE_DIVIDE(fill_rate - mean_fill_4wk, NULLIF(stddev_fill_4wk, 0)), 2) AS fill_z_score,
    ROUND(SAFE_DIVIDE(timeout_rate - mean_timeout_4wk, NULLIF(stddev_timeout_4wk, 0)), 2) AS timeout_z_score
FROM
    seasonal_baselines
WHERE
    metric_hour = DATE_TRUNC('hour', TIMESTAMP_SUB(CURRENT_TIMESTAMP(), INTERVAL 1 HOUR))
    AND total_requests >= 5000
    AND (
        SAFE_DIVIDE(clearing_ecpm - mean_ecpm_4wk, NULLIF(stddev_ecpm_4wk, 0)) <= -3.0
        OR SAFE_DIVIDE(fill_rate - mean_fill_4wk, NULLIF(stddev_fill_4wk, 0)) <= -3.0
        OR SAFE_DIVIDE(timeout_rate - mean_timeout_4wk, NULLIF(stddev_timeout_4wk, 0)) >= 3.0
    )
ORDER BY
    total_requests DESC;
To operationalize this query without overwhelming engineering channels, schedule the job to execute at five minutes past every hour against the prior completed hour's partition, and enforce a two-consecutive-window persistence rule for medium-volume slices (5,000 to 25,000 requests) while firing immediate PagerDuty or Slack webhooks for high-volume slices (> 25,000 requests) whenever ecpm_z_score <= -3.0, fill_z_score <= -3.0, or timeout_z_score >= 3.0. Pairing these automated Z-score triggers with segmented telemetry across Web, Mobile App, and CTV ensures that yield regressions are isolated and remediated within the first hour of impact, protecting both publisher working capital and clean, brand-safe demand delivery.